Agent-based modeling and simulation is characterized by emergent complex behaviors based on the interactions of simple autonomous agents. We have been conducting research on agent-based models of financial systems, especially as a method of assessing regulatory approaches and policies (see the related projects on the home page). Digesting and understanding all the data and emergent behaviors both at the individual agent (micro) level and system (macro) level is an interesting challenge. Our goal in this stream of research is to find a mix of visualization and sonification techniques that helps us understand such complex systems. The idea of enriching our visualizations with sound got us started down the path of generating music from markets.
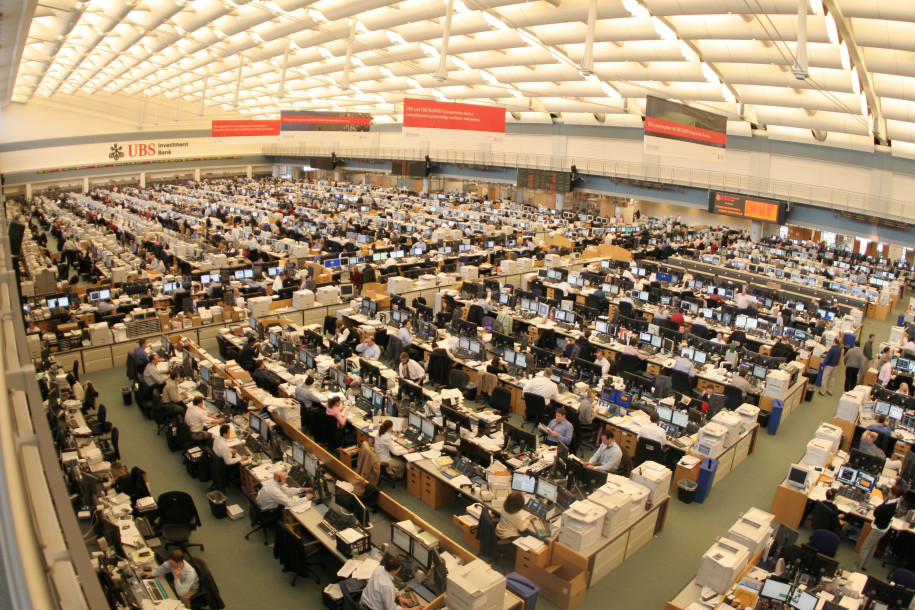
It is interesting that financial practitioners have recognized the value of auditory signals. For example, traders tend to refer to the state of a given market using the terms "market color" (visual) and "market buzz" (sound). The importance of auditory signals is evidenced by the layout of a typical trading room. Traders tend to co-locate in the same physical space without any partitioning or walls between desks, thereby allowing auditory signals to flow freely between trading desks. Fast moving asset classes (such as currencies, which react instantaneously to macro-economic and geopolitical news) tend to be located at the center, with closely connected asset classes (e.g. short term money markets) being placed next to each other. Experienced traders almost unconsciously register the state of the markets using the "market buzz" produced by the various trading desks. To see an impressive example of such a trading floor, have a look at the huge UBS room (now abandoned).
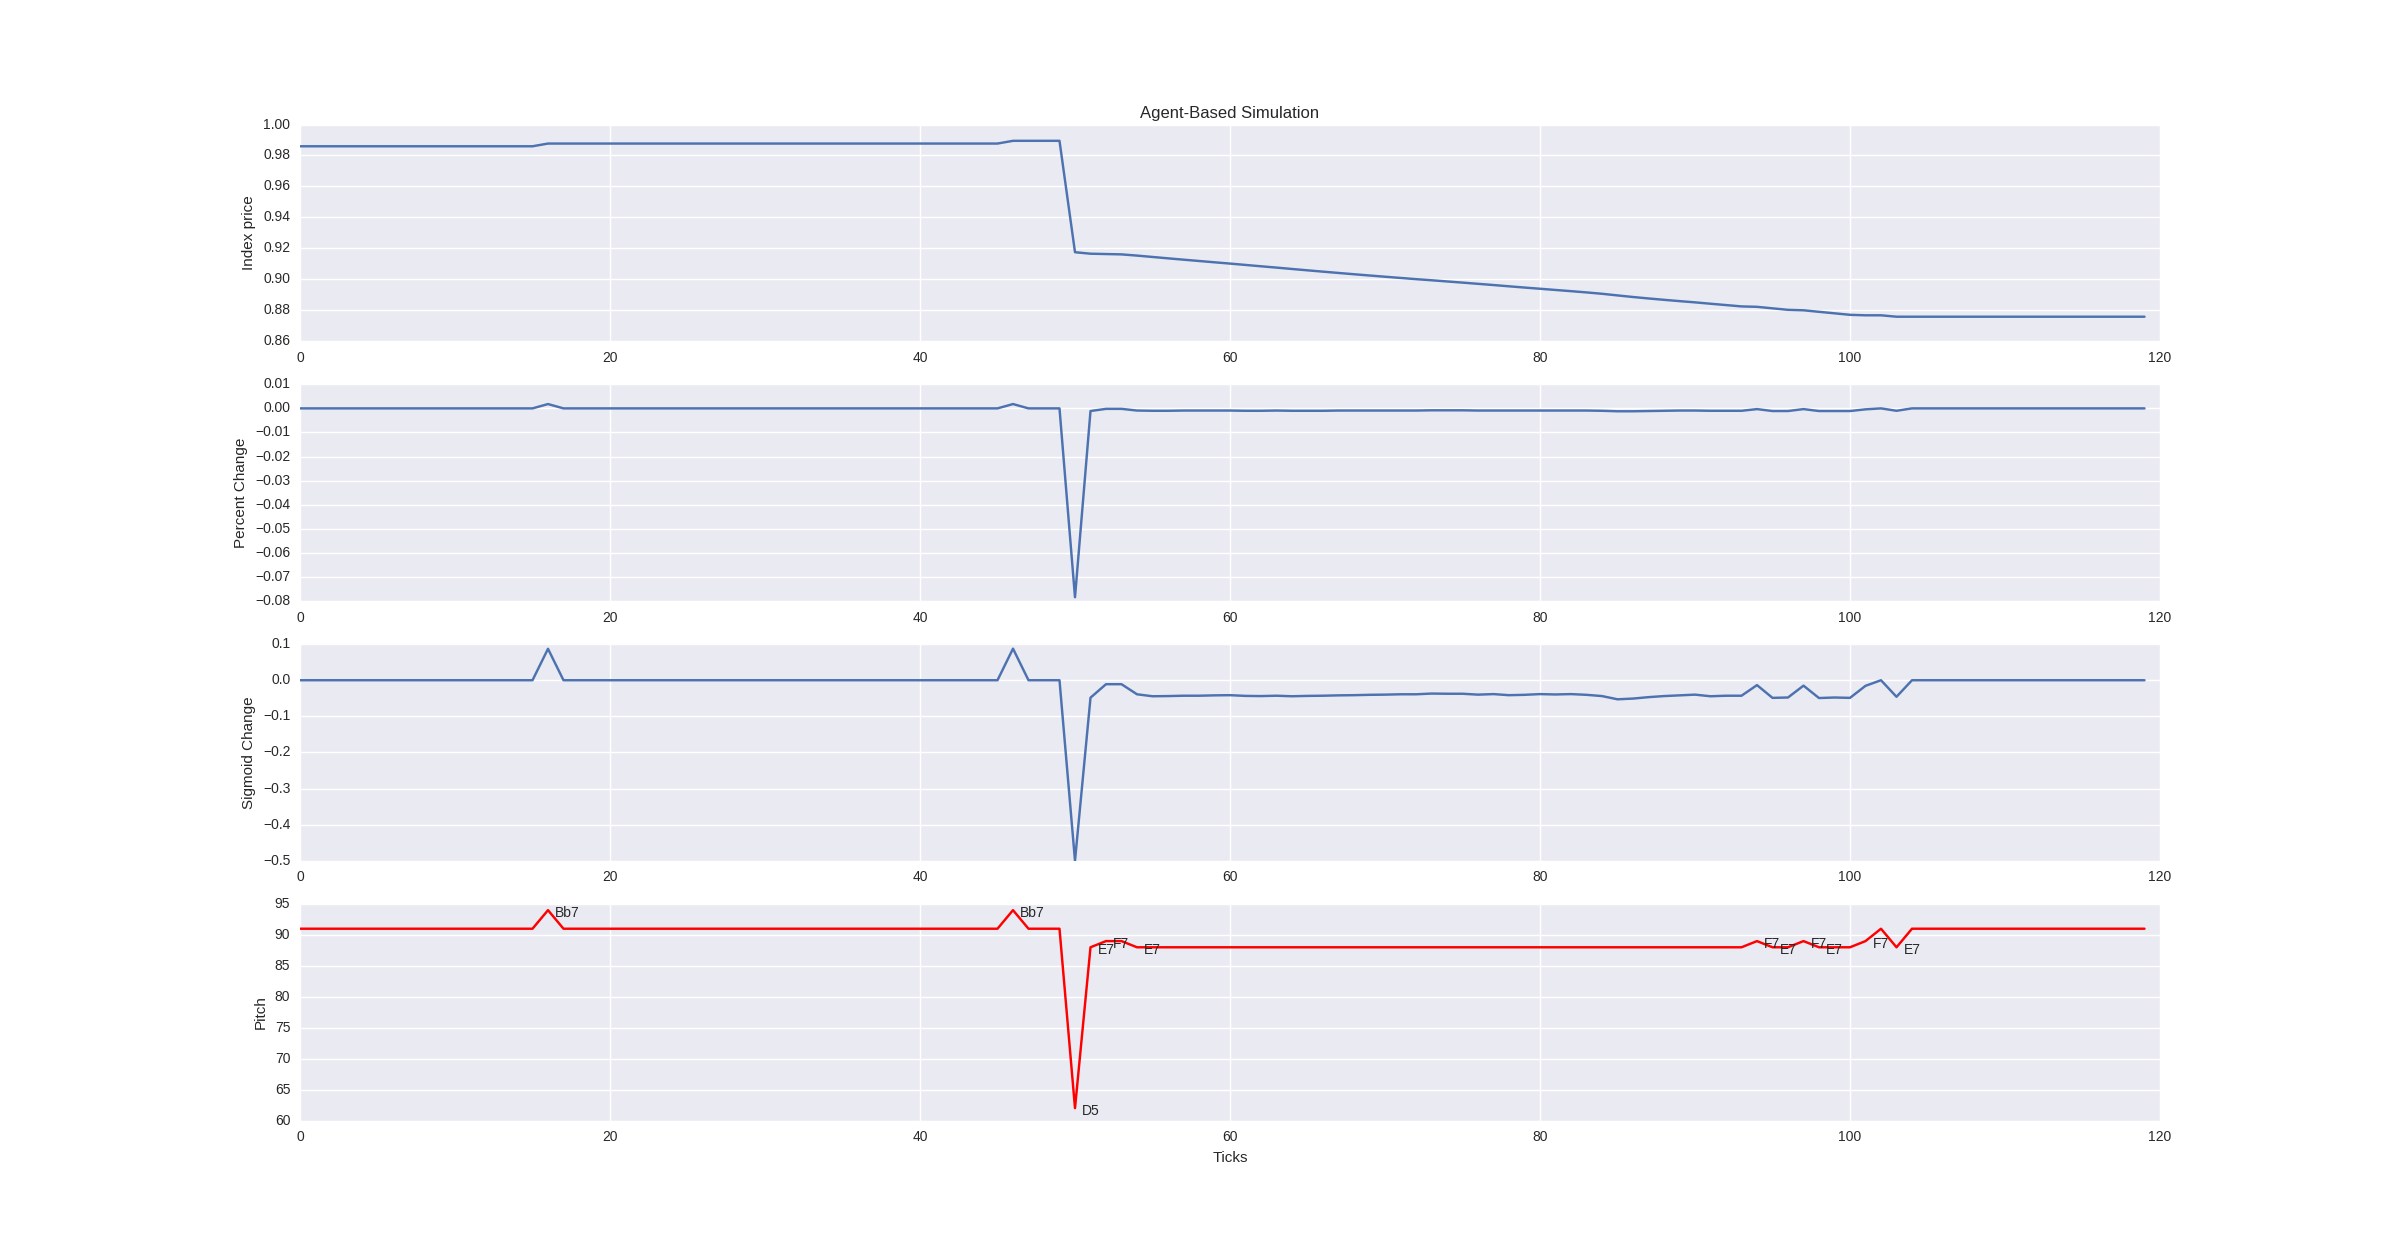
The figure above illustrtates the transformations used to sonify the bond prices from a simple agent-based simulation. The top panel shows the original data, a price index based on five underlying bonds used in the simulation. You can see some distinct events as well. There are just a few trades in the first 50 ticks (the horizontal axis is time in simulation ticks). There are long pauses since no sounds are played unless prices change. Around tick 50, an economic shock is introduced, which causes an immediate and substantial drop in the bond index. A long, but gradual price decline follows (with repeating notes). Finally, there are some trades toward the end that represent more normal price movements.
The series of transformations are shown in the lower panels. First, price changes are used rather than the absolute prices. Next a sigmoid transformation is used to highlight significant changes. The bottom panel shows the pitch, with individual notes marked along the time series. Check out the short (20s) video or audio clips below (thanks to students Saurav Chakraborty and Ratish Dalvi for the excellent implementation work).
In order to test our initial methods for sonifying market data for agent-based simulations, we decided to experiment with some other historical market time series. An obvious choice was the Great Recession, a recent and significant market contraction. The data spans the recession and captures some of the drammatic price swings. The two figures below summarize the steps in data preparation and cleansing, as well as the transformation to a sequence of notes (the final line graph annotated with notes). Short (32s) MP4 and WAV files are available for replay via links below (again thanks to Saurav Chakraborty and Ratish Dalvi for their creative work).

As shown in the figure below, a similar approach was used to assign the notes, but here the musical dynamics are varied based on velocity (the quantitative measure of piano key speed) to modify the loudness. This really helps generate more nuanced market data sonifications.
